


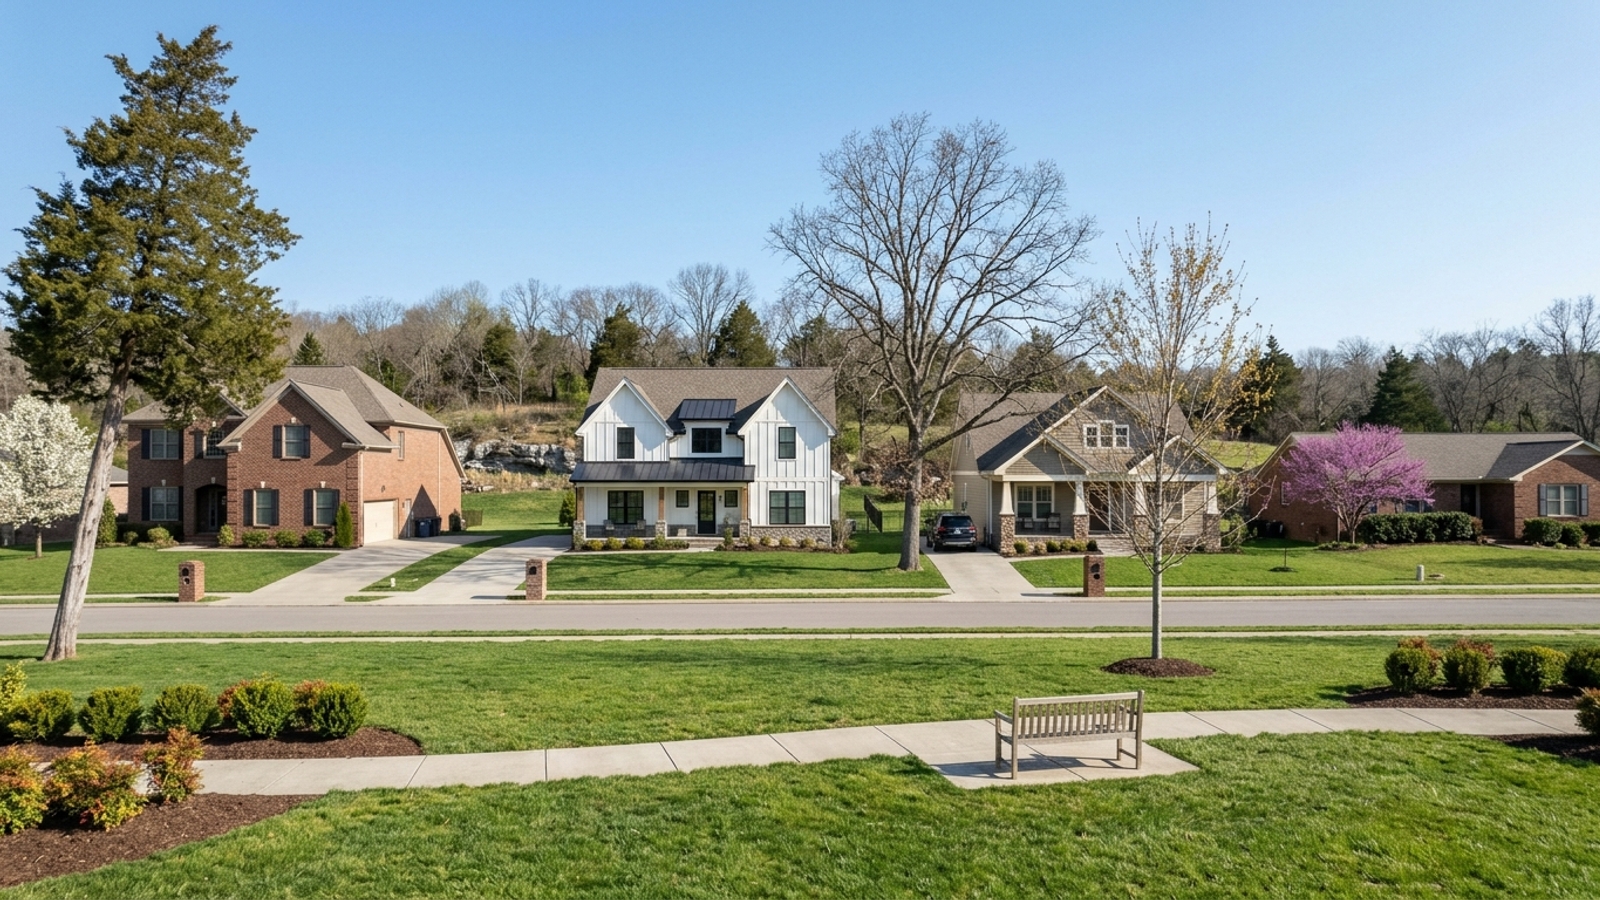
The median sale price for all homes in Nolensville, TN, sits at roughly $949,000, down from a year ago. Buyers and sellers are trying to find middle ground in a shifting market.
Key Takeaway
Expect Nolensville prices to keep giving ground slowly rather than crash. The median sale price for all homes is down 10.9% from a year ago, yet supply remains tight, so the drop reflects buyers pushing back on price rather than too many homes for sale. If you're buying, negotiate hardest on listings that have sat on the market. If you're selling, price to recent sales rather than waiting for last year's peak to return.
Who This Guide Is For
You're deciding whether to buy or sell a home in Nolensville in the next year, or hold off, and you want to know which way prices are likely to move and how much room there is to negotiate.
Where the Nolensville Housing Market Is Heading
Supply in Nolensville sits at just 2.7 months for all homes (90 days ending 2026-09-30), yet prices fell by double digits year over year. With so few homes for sale, the drop comes from buyers refusing last year's prices at the top of the market, not from a glut of listings.
For the bigger picture, see Nolensville Housing Market.
The coming year points to flat-to-soft prices and negotiated sales rather than a flood of cheap listings, though a shift in mortgage rates or new supply could change that. Current Nolensville prices and trends shift from month to month, so recheck the figures before you make an offer or set a price. Specific areas can run above or below the town-wide median, so compare prices by neighborhood before judging a home.
Nolensville Housing Market Indicators
Three indicators explain why prices are softening even though inventory is low, and who holds the advantage at the negotiating table.
Active Listings and Sales Pace
There were 69 active listings against 78 sales over the 90 days ending 2026-09-30, roughly 26 sales a month. Buyers have choices but not a surplus, which is why prices are being negotiated down rather than collapsing. This is a snapshot: a seasonal jump in new listings could lengthen supply quickly, and the price softness with it.
Days on Market
The median Nolensville home takes 63 days to sell, so sellers should plan for at least that long on the market before the closing process even starts. Buyers rarely need to decide the day a home lists, which leaves time for inspections and comparing listings. Well-priced homes go faster and overpriced ones sit far longer, so check each listing's own history rather than assuming every home has the same window.
Sale Price vs. List Price
Homes are closing at 97.7% of list price. On a home listed at $950,000, that ratio implies a sale near $928,000, or about $22,000 under asking. That is real room to negotiate, but not a steep markdown. The ratio is measured against the final list price, so earlier price cuts don't show up in it, and the discount from the original asking price can be larger.
What Could Change the Forecast
Two signals could break the current pattern of slow, negotiated sales: mortgage rates and new construction.
Mortgage Rates
The 30-year fixed-rate mortgage averaged 7.24% as of October 29, 2026, down slightly from 7.32% the prior week, according to Freddie Mac. Rate moves can bring buyers back into the market, or keep them out, faster than local supply changes. Rates can't be forecast reliably, and a drop could bring buyers back quickly. Waiting for a lower rate can therefore mean losing the negotiating room the market offers today. Get a current rate quote from a lender rather than relying on national averages.
New Construction
New subdivisions add supply that competes directly with resale homes and could extend the current price softness. Builder incentives such as rate buydowns or closing-cost credits make a new build's sticker price hard to compare directly with a resale home. Ask builders for current incentives in writing, plus the HOA dues and any transfer or capital-contribution fees.
What the Forecast Means for Buyers
You have time to weigh your options, so target listings that have passed the typical time on market. Ask the listing agent for the original list price and full price-reduction history on those homes. Then negotiate on price or seller credits rather than expecting a bidding war.
If you need help evaluating older listings, a local real estate professional can review the pricing history with you and walk you through the steps for buying a home in Nolensville. When choosing a buyer's agent, ask how they would negotiate on a home that has sat on the market.
What the Forecast Means for Sellers
Pricing a home to last year's peak is the main reason listings sit unsold today. Buyers are pushing back on price, and an overpriced home will stall.
For illustration only: a 3,000-square-foot single-family home at the 90-day median of $302 per square foot (single family, 90 days ending 2026-09-30) comes to about $906,000. Age, lot size, and finishes move this number either way, so treat it as a starting check rather than a final valuation.
Oak Street Real Estate Group can provide a specific home valuation, or you can review the steps for selling a home in Nolensville to prepare your listing.
Should You Buy or Sell in Nolensville Now?
Your timeline and budget decide it:
- If you need to move within the next six months, the forecast matters less than the negotiating room you have today, so start with the buyer or seller section above.
- If the monthly payment caps your budget more than the price does, rates may move your numbers more than local prices will. See the mortgage rates section.
- If you're comparing a new build with a resale home, builder supply and incentives can shift the math, as the new construction section explains.
- If you're planning a list price from a neighbor's sale last year, read the seller section before you set it, because last year's prices aren't today's.
This is market information, not financial advice. Talk to a lender and a licensed agent about your own specific situation.
At a Glance
- Median sale price, all homes: $949,048 (90 days ending 2026-09-30, 78 sales)
- Median sale price, single family: $949,372 (90 days ending 2026-09-30, 77 sales)
- Year-over-year change in median sale price: -10.9% all homes; -15.6% single family (90 days ending 2026-09-30)
- Median days on market, all homes: 63 (90 days ending 2026-09-30)
- Sale-to-list ratio, all homes: 97.7% (90 days ending 2026-09-30)
- Share sold above list price: 6.5% all homes; 6.6% single family (90 days ending 2026-09-30)
- Months of supply: 2.7 all homes; 2.8 single family (90 days ending 2026-09-30)
- Active inventory, all homes: 69 listings (90 days ending 2026-09-30)
- Median price per square foot: $301 all homes; $302 single family (90 days ending 2026-09-30)
Nolensville Housing Market Forecast FAQs
Are Home Prices Dropping in Nolensville?
Yes. The single-family median sale price is down 15.6% year over year, a steeper drop than for all homes. Because it partly reflects last year's mix of sales, treat both figures as a general direction rather than an exact decline.
What Is the Median Home Price in Nolensville?
The median sale price for all homes in Nolensville is $949,048 for the 90 days ending 2026-09-30.
Is Nolensville a Buyer's or Seller's Market?
It's a mixed market. Supply remains tight, but only 6.5% of all homes sold above list price, so bidding wars are rare and buyers can negotiate.
Is Nolensville Expensive to Live In?
Home values reflect a higher price point, with a median of $301 per square foot for all homes. When weighing the pros and cons of living in Nolensville, look past the price to your daily commute, budget and desired home size.
What County Is Nolensville In?
Nolensville is in Williamson County. For 2026, the Williamson County Trustee lists Nolensville's city rate at $0.34 per $100 of assessed value plus the county rate of $1.30, for a combined $1.64 per $100 of assessed value. Confirm the rate for your address with the Trustee.
What Is the Long-Term Housing Forecast for Nolensville?
Long-term demand depends on growth and rates, which no one can forecast precisely. The town's population estimate was 15,809 as of July 1, 2024. The Town of Nolensville land use plan shows projected housing units that could affect future supply.
Sources
- Redfin: Data Center
- Freddie Mac: Primary Mortgage Market Survey
- Town of Nolensville: Official Website
- Williamson County Trustee: 2026 Property Tax Rates Calculator